
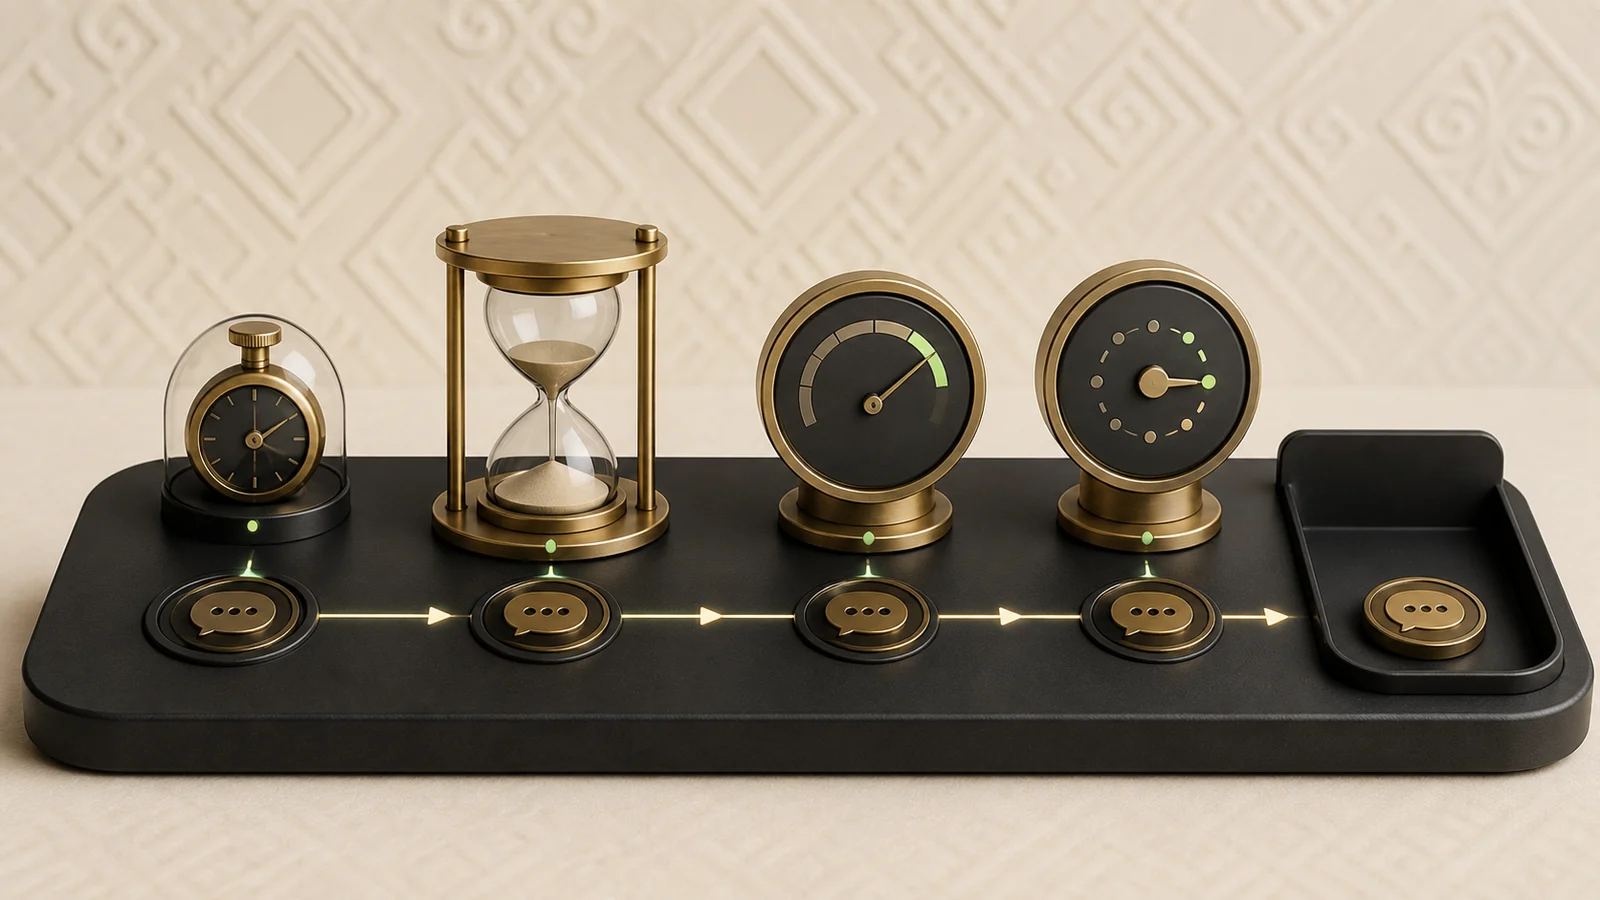
First response time measures how long a customer waited for the first meaningful answer. Resolution time measures the path from the initial request to an outcome. SLA compares actual service with a previously defined target. CSAT reflects ratings from customers who answered a post-interaction survey. Each metric answers a different question.
A metric becomes useful only when the team agrees on its start, pauses, and end—and knows what action follows a deviation.
First response time
FRT runs from the first inbound message to the first meaningful agent response. An automatic “we received your message” can reassure the customer, but it should not count as a human first response when measuring actual team availability.
Use the median and high percentiles, not only the average. A convenient average can hide a small group of very long waits. Segment by channel, operating hours, and queue.
Resolution time
This is the time from request creation to a confirmed outcome. An agent closing a conversation does not always mean resolution; the customer may return with the same problem. Define whether time waiting for the customer or another team is included, and expose those components separately.
SLA
An SLA is an agreed service target, such as first response during operating hours or resolution for a P1 incident. It is not one universal number for all messages. The rule should answer five questions: for whom, which priority, which measure, which calendar, and what escalation follows a breach.
CSAT
CSAT is commonly the share of positive ratings among received survey responses. Always show invitations sent, responses received, and the scale. If only the happiest or angriest customers respond, the score does not describe everyone. Comments often explain more than the number itself.
A one-week example
A team receives 300 conversations, gives a meaningful response to 240 during operating hours, and resolves 210. Analyze the FRT distribution for 240 responses; analyze resolution for 210 completed cases plus the unresolved backlog. If 180 CSAT invitations generate 36 responses, report the score with a 20% response rate rather than presenting it as the opinion of all 300 customers.
Common mistakes
- counting an automatic acknowledgement as the agent response;
- showing an average without median, percentile, or volume;
- closing conversations early to improve resolution time;
- mixing business and non-business hours without a calendar;
- comparing teams with very different case complexity;
- showing CSAT without the number of responses;
- ignoring unassigned work and unresolved backlog.
A minimum management dashboard
- new, open, and unassigned conversations;
- median and P90 first response by channel;
- median resolution by request type;
- SLA attainment by priority;
- CSAT with response count and response rate;
- customers returning with the same issue after closure.
Frequently asked questions
What is a good first response time?
There is no universal number. Set the target from the customer promise, channel, operating hours, urgency, and available resources. Measure a baseline first.
Should resolution time pause while waiting for the customer?
You can show total and active time separately. The important part is to document the rule in advance and not change it to improve the report.
Can CSAT compare individual agents?
Only with caution, sufficient sample size, and case-complexity context. Topic and comment analysis is often more useful for process improvement.
Methodology
Joop.kg recommends documenting each metric’s formula, calendar, exceptions, segments, and sample size. A dashboard should lead to an action: rebalance the queue, change staffing, improve knowledge, or repair escalation.